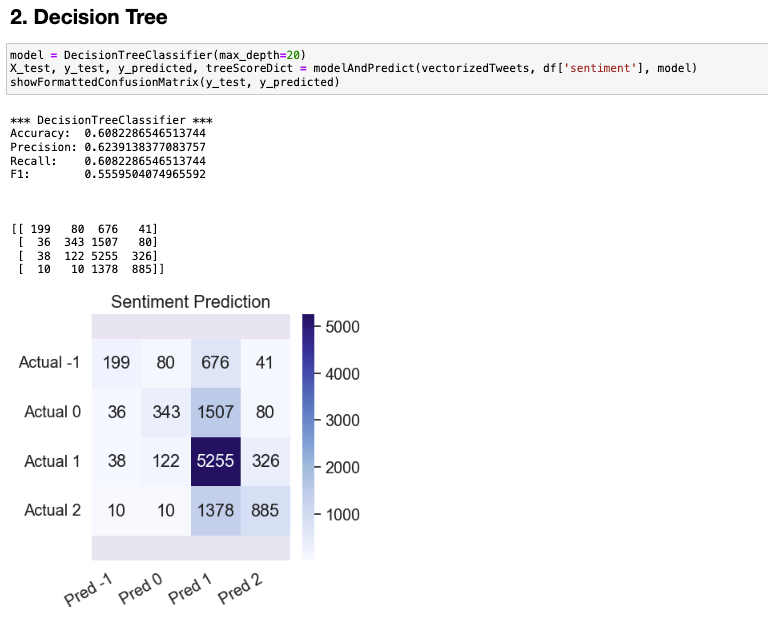
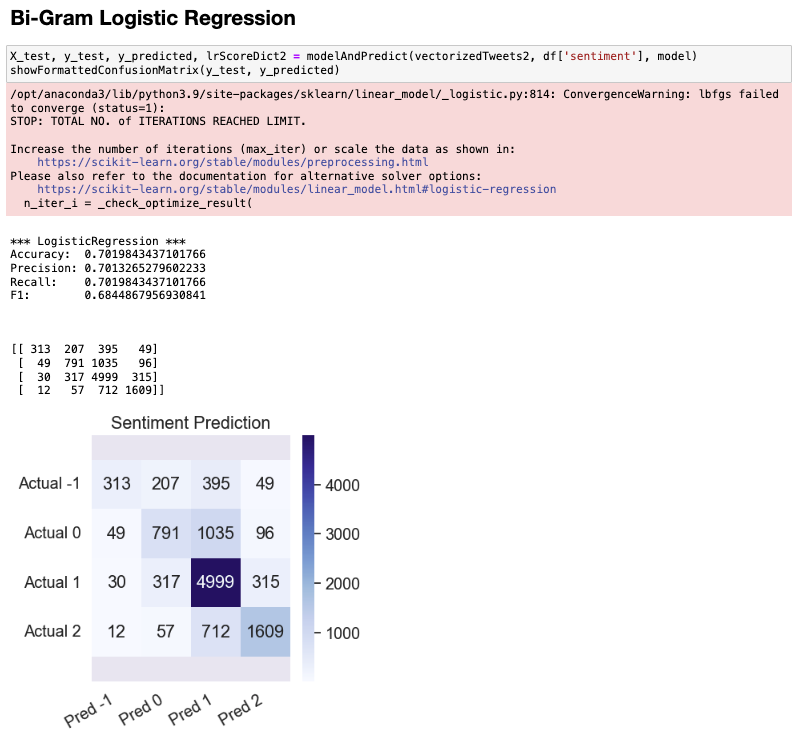
About the Project
This repository is dedicated to predicting the stock prices of Tesla (TSLA), or any other desired stock, using ensemble learning methods, namely Bagging and AdaBoost. The goal is to utilize historical stock data to forecast future prices and evaluate the predictive power of these models.
About the Project
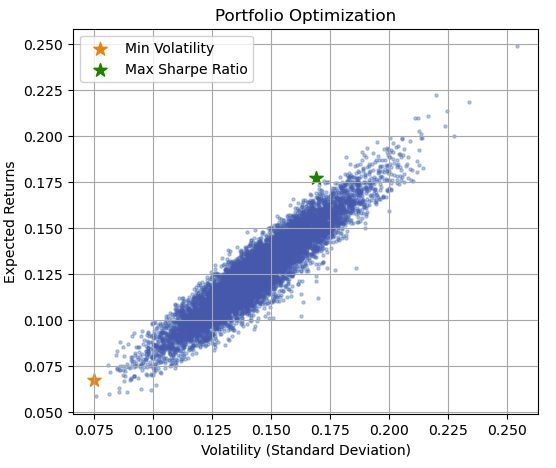
This repository contains a Jupyter Notebook and associated data files for a portfolio optimization analysis project. The project applies quantitative techniques to determine the optimal asset allocation that maximizes returns for a given level of risk.
ESG Data Analysis and Visualization Repositories
Welcome to my ESG Data Insights and Visualization repository on GitHub, where I showcase my expertise in analyzing and visualizing Environmental, Social, and Governance (ESG) data. This space is dedicated to demonstrating my skills in data processing, from initial exploration to advanced visual storytelling. This space will be continually updated.
- Data Exploration: Discover my detailed analyses of ESG datasets, revealing key trends and insights.
- Data Cleaning and Transformation: See how I refine raw data into structured, analysis-ready formats, ready for deep dives.
- Advanced Visualizations: Explore complex visualizations crafted with tools like Matplotlib and Seaborn, turning data into clear, engaging narratives.
- Documentation and Methodology: Each project is well-documented, outlining objectives, processes, and findings for transparency and reproducibility.
- Analysis and Machine Learning Tools: Explore the integration of advanced analytical techniques and machine learning models.
- Collaboration: Contributions and discussions from the data science community are welcomed, fostering collective learning and growth.
- S&P 500 ESG Risk Ratings Analysis:
This project presents an in-depth analysis of ESG (Environmental, Social, and Governance) risk ratings among S&P 500 companies. Using Python libraries like NumPy, Pandas, and SciPy, I explored and statistically analyzed the dataset to understand ESG risk distribution and trends.
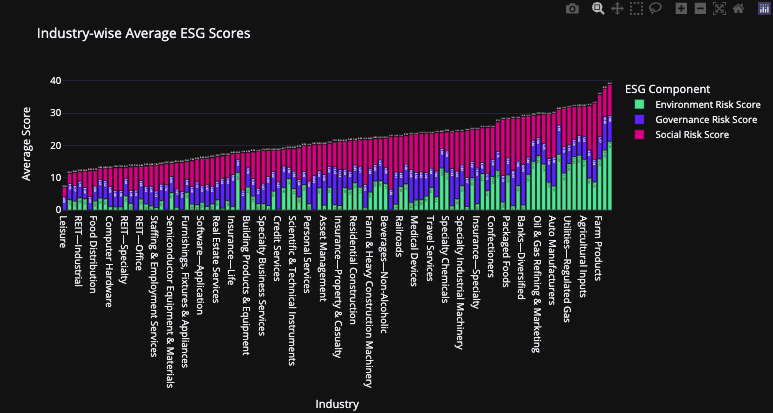
Key highlights include:
Data Exploration: Initial dataset assessment to identify key characteristics.
Statistical Analysis: Correlation and trend analysis to uncover hidden insights.
Visualization: Employed Matplotlib, Seaborn, Plotly Express, and WordCloud to create compelling visual narratives of ESG risk profiles.
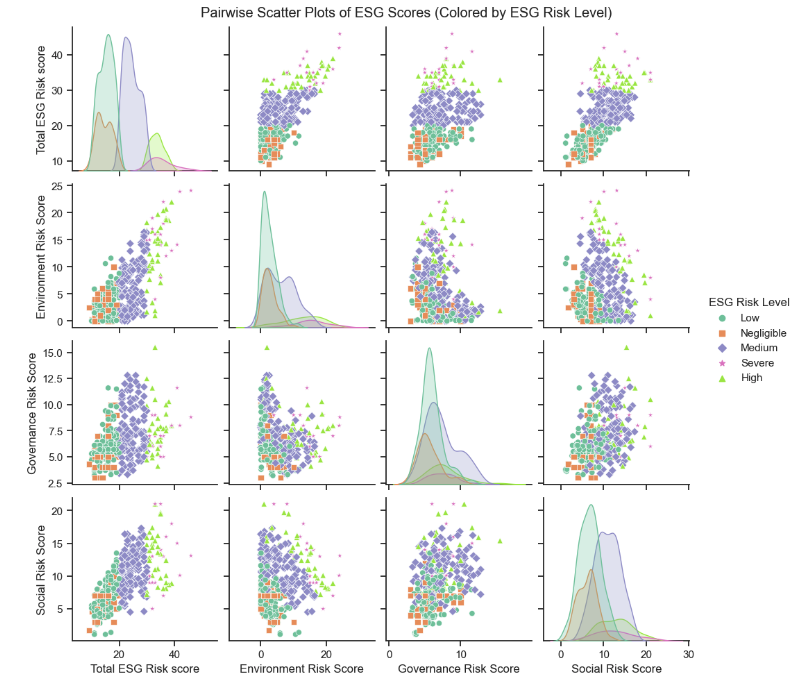
The analysis offers valuable insights into ESG risk trends across major sectors, providing a clear view of corporate sustainability practices. (link)
- ESG Insight: Unveiling Business Sustainability and Financial Performance
The "ESG Insight" project is a comprehensive exploration of the interplay between Environmental, Social, and Governance (ESG) principles, business sustainability, and financial performance. Through rigorous data analysis, this project endeavors to unearth valuable insights that can benefit investors, inform policymaking, and guide businesses towards more sustainable practices.
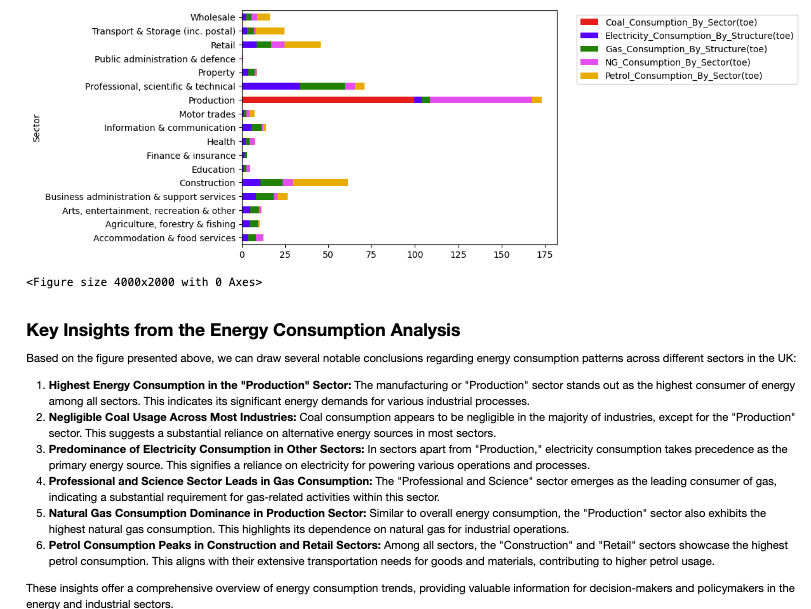
Key highlights include:
- Sector-wise analysis of ESG impact.
- Assessment of energy consumption patterns.
- Evaluation of turnovers in relation to ESG metrics.
This project serves as a beacon, illuminating the path towards a more environmentally conscious, socially responsible, and financially viable future.
(link)
Exploration to Visualization
I specialize in transforming complex datasets into clear insights. Leveraging pandas and numpy, I refine and analyze data, ensuring it's clean and structured. With matplotlib, and its counterparts like seaborn and plotly, I craft visual narratives that make data interpretation intuitive.
- Data Exploration Pandas College Major (link)
- Spotify Data Exploration (link)
About the Project
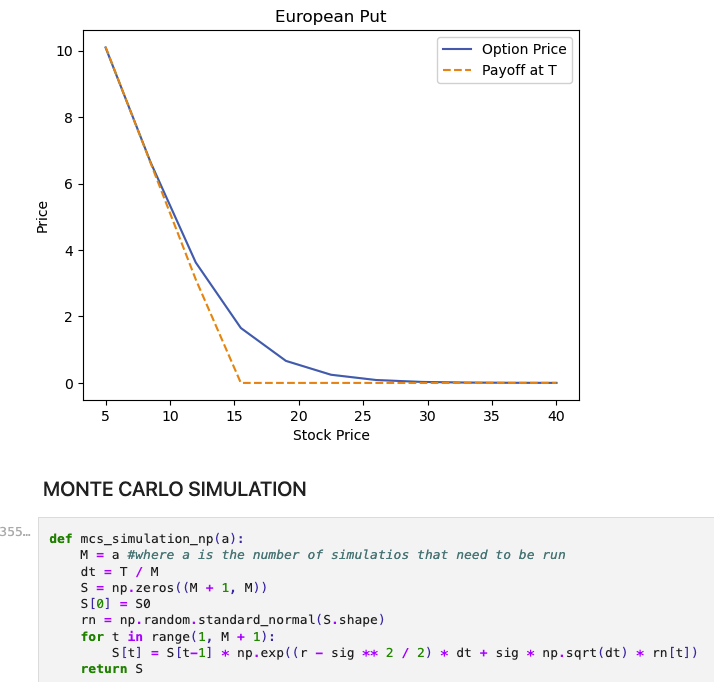
I've crafted a sophisticated Solana derivative model using the European Black-Scholes formula, integrated with Monte Carlo simulation techniques. This robust approach allowed me to accurately price the derivative, taking into account the volatility and unique characteristics of the Solana cryptocurrency.
(link)
.png)